Data and statistics
Data and statistics related to our regulatory activities and the New Zealand rental market.
Rental bond data
The rental bond data provides information about the activity level in the housing rental market since January 1993.
The data comes from our tenancy bond database, which records all new rental bonds that are lodged with us each month.
Dispute resolution statistics
Every quarter, Tenancy Services publishes a high-level summary of the volume of dispute resolution applications received, and the types of disputes detailed in those applications. Data includes applications made to Mediation, Tenancy Tribunal, and FastTrack.
Latest Statistics - Q2 2026 (01 April - 30 June 2026)
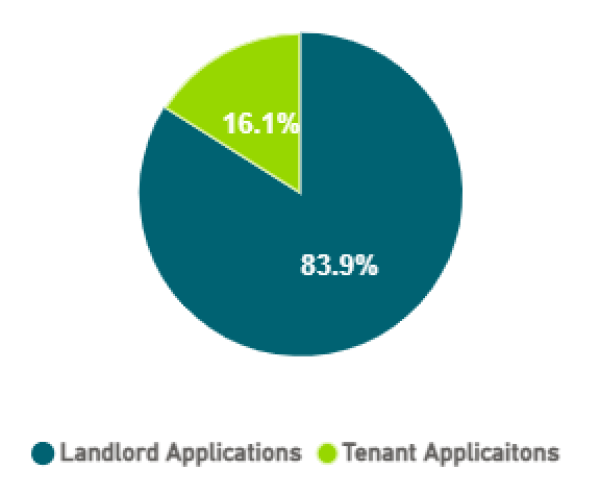
Who made applications to the Tenancy Tribunal?
| Landlord applications | Tenant applications |
|---|---|
| 6,767 | 1,294 |
Where were the tenancies related to Tenancy Tribunal applications?
| District of tenancy | % | |
|---|---|---|
| 1 | Auckland | 43.08% |
| 2 | Christchurch | 7.48% |
| 3 | Hamilton | 4.29% |
| 4 | Wellington | 3.66% |
| 5 | Papakura | 3.04% |
What were the Tenancy Tribunal applications about?
Note: there are more disputes than applications, as a single application can be about a number of different disputes.
| Overall: top disputes detailed in applications | Number of applications | % | |
|---|---|---|---|
| 1 | Rent arrears | 4,680 | 58.06% |
| 2 | Refund bond | 3,487 | 43.26% |
| 3 | Termination/possession | 3,026 | 37.54% |
| 4 | Compensation / damages | 2,812 | 34.88% |
| 5 | Outgoings | 1,496 | 18.56% |
| 6 | Exemplary damages | 739 | 9.17% |
| 7 | Remedy of breach | 439 | 5.45% |
| 8 | Healthy homes standards | 368 | 4.57% |
| 9 | Failure to maintain | 347 | 4.30% |
| 10 | Quite enjoyment | 235 | 2.92% |
Landlord applicant: top disputes
| Landlord applicant: top disputes | Number of applications | % | |
|---|---|---|---|
| 1 | Rent arrears | 4,680 | 69.16% |
| 2 | Termination/possession | 3,026 | 44.72% |
| 3 | Refund bond | 2,841 | 41.98% |
| 4 | Compensation / damages | 2,192 | 32.39% |
| 5 | Outgoings | 1,482 | 21.90% |
| 6 | Remedy of breach | 437 | 6.46% |
| 7 | Exemplary damages | 268 | 3.96% |
| 8 | Notice to quit | 166 | 2.45% |
| 9 | Disposal of goods | 138 | 2.04% |
| 10 | Abandoned | 130 | 1.92% |
Tenant applicant: top disputes
| Tenant applicant: top disputes | Number of applications | % | |
|---|---|---|---|
| 1 | Refund bond | 646 | 49.92% |
| 2 | Compensation / damages | 620 | 47.91% |
| 3 | Exemplary Damages | 471 | 36.40% |
| 4 | Healthy homes standards | 368 | 28.44% |
| 5 | Failure to maintain | 347 | 26.82% |
| 6 | Quiet enjoyment | 227 | 17.54% |
| 7 | Reduction of fixed term | 196 | 15.15% |
| 8 | Work order | 161 | 12.44% |
| 9 | Other miscellaneous orders | 139 | 10.74% |
| 10 | Moisture and drainage | 116 | 8.96% |
Download PDFs
Current quarter
Previous quarters
- 2026, Q1 (1 January to 31 March) [PDF, 538 KB]
- 2025, Q4 (1 October to 31 December) [PDF, 538 KB]
- 2025, Q3 (1 July to 30 September) [PDF, 534 KB]
- 2025, Q2 (1 April to 30 June) [PDF, 147 KB]
- 2025, Q1 (1 January to 31 march) [PDF, 140 KB]
- 2024, Q4 (1 October to 31 December) [PDF, 156 KB]
- 2024, Q3 (1 July to 30 September) [PDF, 135 KB]
- 2024, Q2 (1 April to 30 June) [PDF, 137 KB]
- 2024, Q1 (1 January to 31 March) [PDF, 143 KB]
- 2023, Q4 (1 October to 31 December) [PDF, 135 KB]
- 2023, Q3 (1 July to 30 September) [PDF, 192 KB]
- 2023, Q2 (1 April to 30 June) [PDF, 145 KB]
- 2023, Q1 (1 January to 31 March) [PDF, 146 KB]
- 2022, Q4 (1 October to 31 December) [PDF, 123 KB]
- 2022, Q3 (1 July 2022 to 30 September) [PDF, 167 KB]
- 2022, Q2 (1 April to 30 June) [PDF, 171 KB]
- 2022, Q1 (1 January to 31 March) [PDF, 169 KB]
- 2021, Q4 (1 October to 31 December) [PDF, 162 KB]
- 2021, Q3 (1 July to 30 September) [PDF, 168 KB]
- 2021, Q2 (1 April to 30 June) [PDF, 168 KB]
- 2021, Q1 (1 January to 31 March) [PDF, 168 KB]
- 2020, Q4 (1 October to 31 December) [PDF, 169 KB]
- 2020, Q3 (1 July to 30 September) [PDF, 170 KB]
- 2020, Q2 (1 April to 30 June) [PDF, 167 KB]
- 2020, Q1 (1 January to 31 March) [PDF, 124 KB]
Last updated: 17 July 2026